I expected that we were about to see a dramatic reduction in speed, in the service of extending runway. That is the trade you accept when you cut a third of the engineering team. We had every reason to think we were making it, because we were also about to ask everyone still here to work in a way none of us had worked before.
The data says we did not make that trade.
April was the month we jumped in headfirst. We had been experimenting with LLMs for code authoring and other engineering tasks before then, but this was when we reorganized around them, reworking both our definition of what engineers do and our processes.
The short version here is that the numbers are large, with features shipped up 120%.
The caveats are in a footnote1. They don’t change our feelings about the data, but they do help us contextualize it so that we don’t overfit in our process changes as we go forward.
Throughput went up, way up
That reduction was necessary, and part of the impetus for the shift itself. It shrank the engineering team by about 35%, and it included many wonderful members of our team. In the past this sort of reduction would have dramatically limited the amount that we could accomplish.
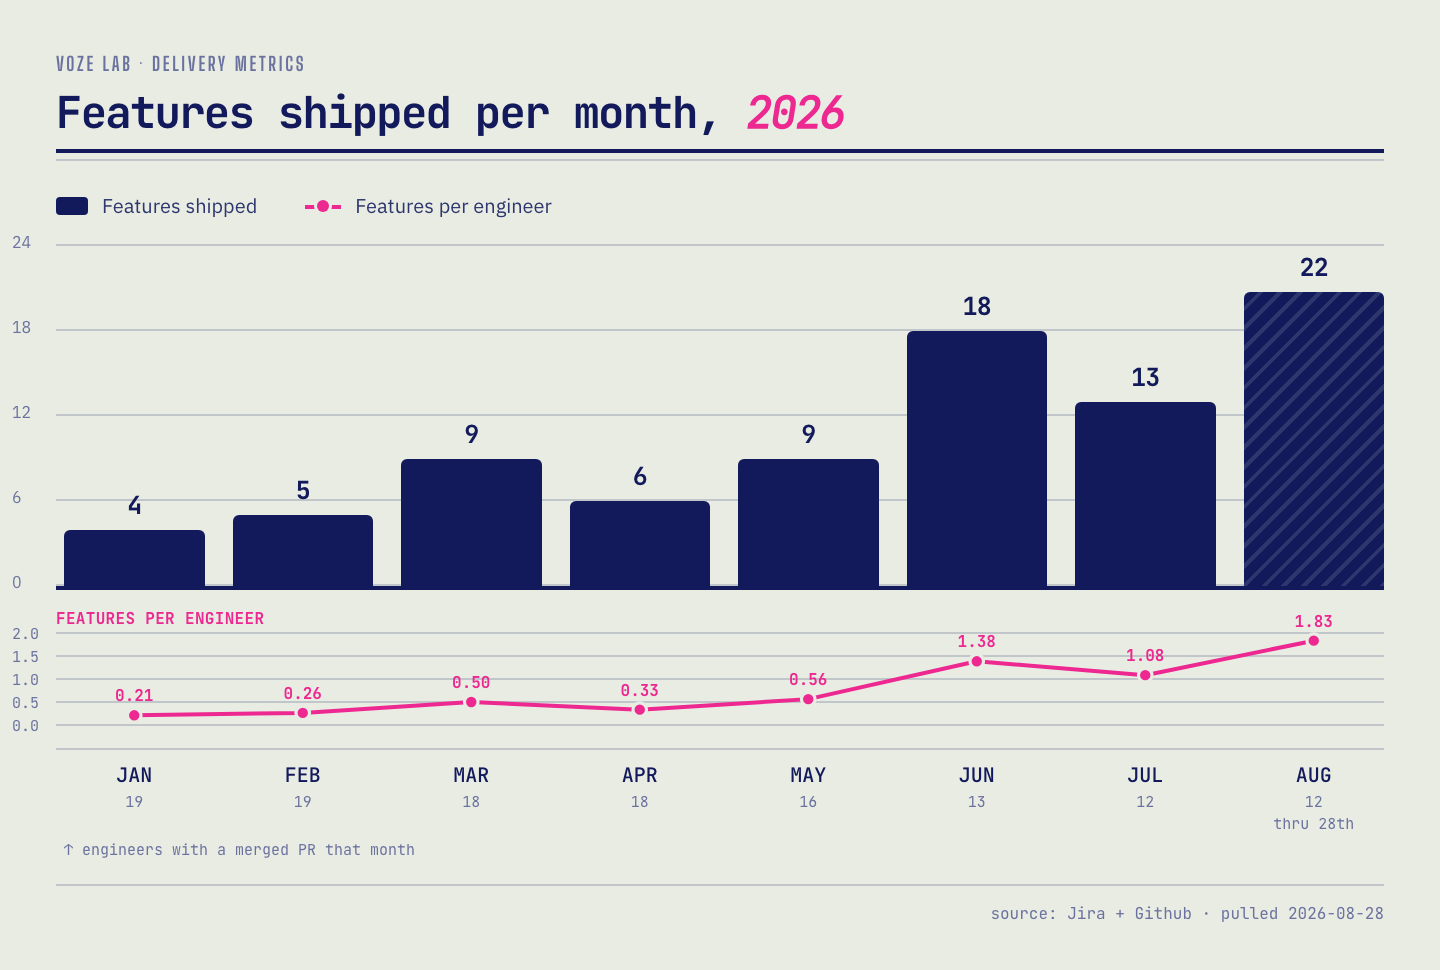
Features shipped per month, 2026. An epic counts once, at the moment it first reaches a terminal state. Bulk hygiene closes are excluded, and were more common before the shift. August is partial, through the 28th.
This time it did not.
For instance, merged pull requests (PRs) per day rose by 3.5%, moving from 14.4 to 14.9. Production deployments rose by 25%. Features shipped per month rose from 6.4 to 14.1, a 120% increase2. PRs per engineer per day increased from 0.78 to 1.24. Across the board we looked better on the DORA metrics, the industry standard set for measuring software delivery.
Those aggregate numbers only tell part of the story though. When we look at the per engineer numbers the change is even starker.
Features per month per engineer went from 0.34 to 1.18, a 247% change in throughput. Those are averages across each period; the monthly line in the chart above runs further still, from 0.21 in January to 1.83 in August. This represented a large increase in the number of problems we could solve for our customers. 247% more features were landing in our customers’ hands each month. August is not a complete month, but it continues this trend with 22 features shipped, pushing the average even higher.
What about quality?
The tradeoff we fully expected to be making was a traditional one around quality. You can always cut some corners to get more speed in engineering projects. Reported bugs rose about 13% between the two periods.
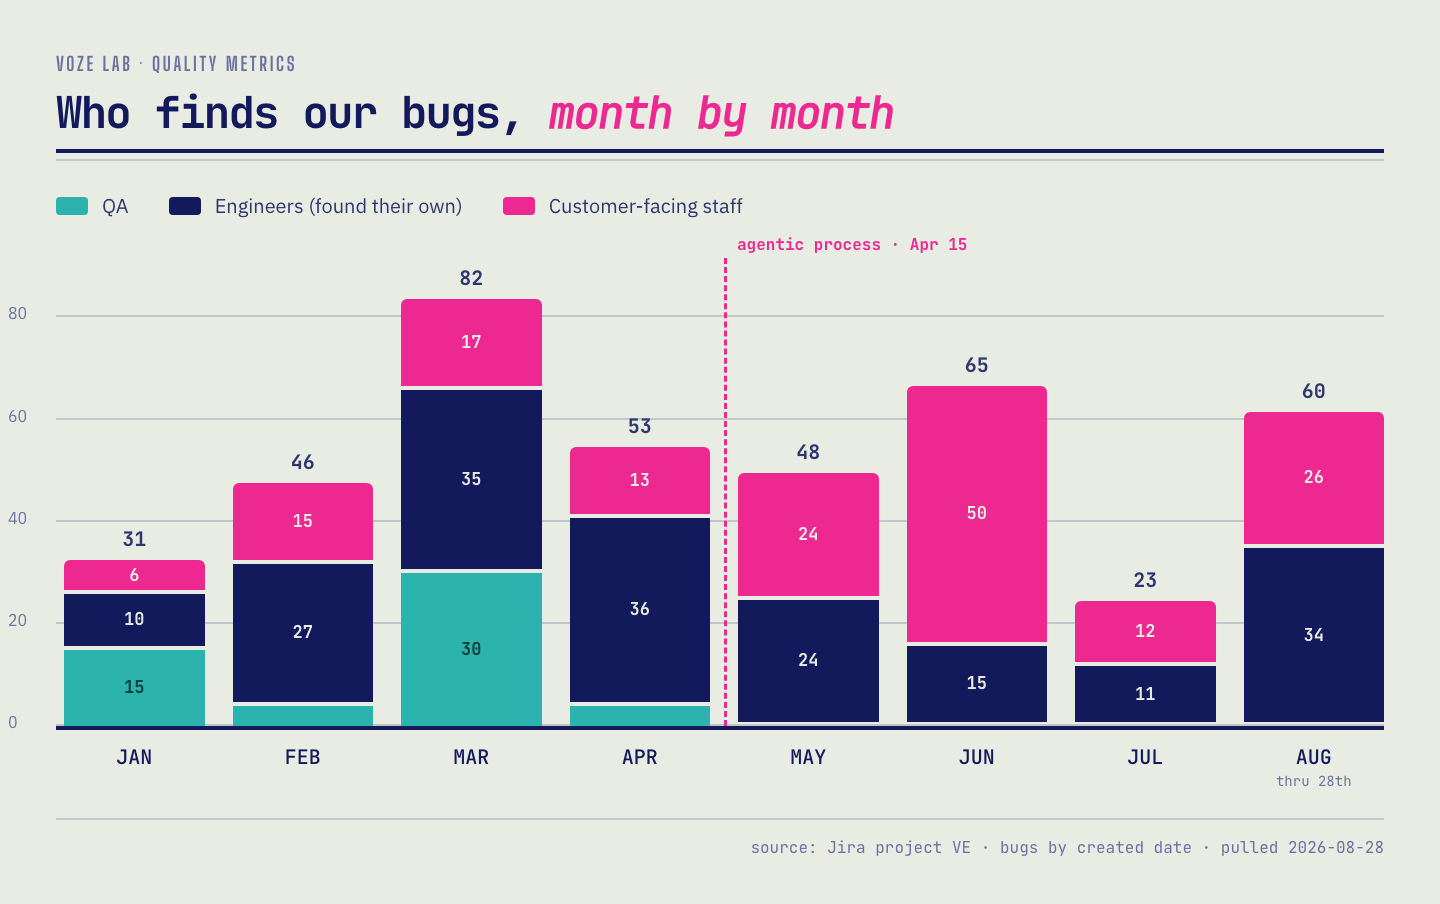
Who finds our bugs. Jira bugs by the month they were filed, grouped by reporter. QA disappears as a channel after April — the last QA-filed bug was April 23. Support tickets are excluded; counting them raises the customer-facing share further. August is partial, through the 28th.
We also saw a significant shift in who was finding bugs. Before, QA represented the majority of bugs filed. After, we saw that shift over to our customer-facing roles. An expected shift with the QA team’s departure.
The other shift in who was reporting bugs was that engineering found fewer bugs. There are many things that this could point to, but without more digging it is hard to say exactly why. For instance, it could be that more bugs were found in code review, and corrected before merging. It could be that we have significantly shifted away from working on our oldest and buggiest codebases, in favor of their replacements. It could also be that engineering was just catching fewer bugs because they were doing a poorer job finding them. Or engineers are builders, and builders are not naturally adversarial about verifying what they helped build.
The final confounding variable in the quality data was that the period of change coincided with the rapid onboarding of customers onto a wholly new mobile app and backend system. Voze Pro is that new app. The chart below tracks customers moving onto it, counting the people who opened each app’s home screen on an average weekday: Voze Pro went from under 1% of the combined total in mid-April to 45% by the end of August, and somewhere in there it became responsible for the majority of our note creation3. Some of the bug volume is the expected identification of issues in a largely new system as more and more users flood into it.
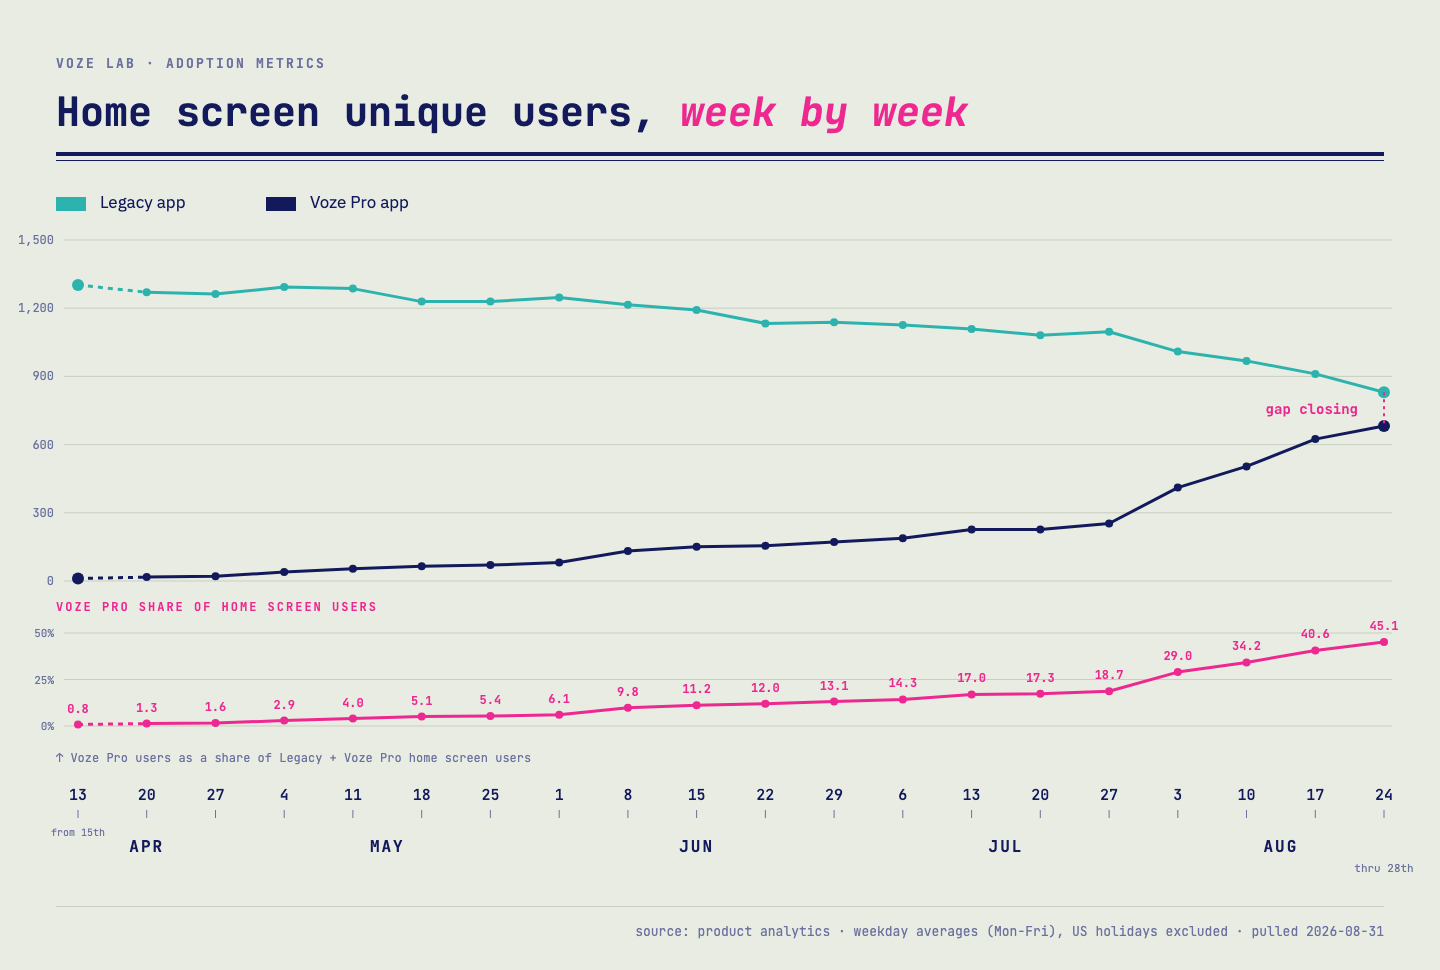
Home screen unique users, week by week. Weekday averages (Mon-Fri); Memorial Day and July 3 excluded. The first week covers Apr 15 through 17 only. August is partial, through the 28th.
With the number of moving parts behind the bug counts, it’s something we’ll watch as we move forward but not something entirely surprising both from a volume of new things shipping, and a mass migration into a new system perspective.
How about deploys and uptime?
The rest of the DORA picture: deployment frequency rose 25%, and build success inched up from 94.1% to 94.6%. Uptime was largely unchanged at 99.97%, dropping to 99.96% against our 99.9% target.
Reverts moved from 1.13% to 1.51% of merged PRs, four tenths of a percentage point in absolute terms. DORA’s 2025 report found that AI adoption still correlates with lower delivery stability even as its relationship with throughput turned positive, and we expected to feel that more than we did.
The changes here were either in the right direction or small, especially against a doubling of delivery.
Where it worked in ways we did not plan for
New capabilities and system rewrites got cheap. For instance our rewrite of our search service was completed in a week. Our internal sandbox for building ad hoc sites and reports to share with customers was built in three days. We were hopeful that this would be the case, but even I was surprised with some of the outcomes. This has paid dividends when it comes to empowering internal teams in ways that we never would have prioritized in the past.
The same economics made debt paydown much more affordable. A single engineer created 76 PRs to address lint errors for a new rule, in a single day. Every one of them went through both a human and a machine reviewer. It’s a rate of cleanup that we’ve all wanted for a long time.
We are also moving off legacy infrastructure in Azure and onto new infrastructure in AWS. Agentic tooling has let that migration proceed without dramatically impacting delivery of features to customers. When it only takes a few minutes to clean up a mess, it’s easier to clean up messes.
What was unexpected
The unexpected thing was that humans wrote fewer comments on PRs in code review. Human commentary per PR fell approximately 38%, while median PR size rose 81% and PRs over a thousand lines went from 6.7% to 10.7%.
The machines picked up what the humans put down. Machine-authored review threads went from 37% of the total to 82%. We were already running AI review before April using Cursor as an experiment. So this is a change in the mix, not machines arriving somewhere they had never been.
The truth is that we don’t know if this is a bad thing or not at this point. But the two numbers point the same direction: the changes are getting bigger while the humans looking at them are saying less. That is the combination that would let a quality problem through quietly, and given how much moved in our bug data this period, we would not necessarily see it. So we are watching it.
Therefore what?
We’ve learned an enormous amount as we have gone through this shift, from finding the right balance between humans and machines, to rethinking the outcomes we want to see from our process.
We already know two other things we want to change. The first is AI code approvals for classes of changes we are comfortable handing to AI reviewers alone; the policy changes to support that are written and waiting on our SOC 2 audit to complete. The second is redefining what human code review is for, and more on that in another post.
We’ve rebuilt our process from the ground up around sharing the mental load as much as we can across team members, and building with AI tools. Even so we are seeing a higher rate of folks on the edge of burnout than we have in the past. This is anecdotal, but aligns with the evidence in recent studies4.
I was wrong about the trade. We did not pay in speed, and we did not pay in quality as much as industry data made it seem like we would. If there is a bill, it is showing up in the people who are still here. That is the part we have the least data on, and the most work to do. That is where the next four months go.
Footnotes
-
Data Caveats! Our ticketing data is unusable before November 2025: there were no resolved issues in August and September 2025, then 2,868 in October from a migration bulk hygiene close. There were two further bulk hygiene close events: June 2026 (385 of 699 resolved issues were created more than three months earlier) and August 2026 (79 stale). All figures filter these. For our build statistics, one of our build tools only had data retained back to February 19, 2026. August 2026 is a partial month because of when this article was written. All rates are per working day. ↩
-
We checked whether epics got smaller after the change, using lines of code per epic as a rough proxy for size. It is not a good measure of size, but it is the one we had. Some got bigger and some got smaller, so it came out close to a wash. We’d be more reserved about this number if we had seen them only go down. ↩
-
The primary user interaction in our product is the creation of recorded notes for transcription, which we then take action on based on their content. ↩
-
At What Cost? Software Developers’ Well-Being in the Age of GenAI discusses similar things, but approaches it from a “what should we do to fix it” perspective. They also point to other studies in the area that are worth reading. My hunch is that this is due in part to the “novel stimuli” and will become less pronounced with time and exposure. I don’t think it’s only that because there is also a higher volume of work being done. ↩
For papers, posts, and the curious.
BibTeX, plain text, and a permanent URL — for if you want to point your future self back here.
title = "Four Months of Agentic Engineering, Measured",
author = "Sellers, Daniel",
year = 2026,
series = "Voze Lab",
volume = 1,
number = 5,
url = "https://lab.voze.com/four-months-of-agentic-engineering-measured"
}